Annotation Enrichment Analysis - An Alternative Method for Evaluating the Functional Properties of Gene Sets

Kimberly Glass, Michelle Girvan

Keith Hughitt

Overview

  • Recent high-throughput methods (microarray, RNA-Seq, etc) made it easy to produce large datasets comparing samples in different conditions.
  • The end result of many of these analyses, however, is often a large list of genes that are associated with one condition or the other.
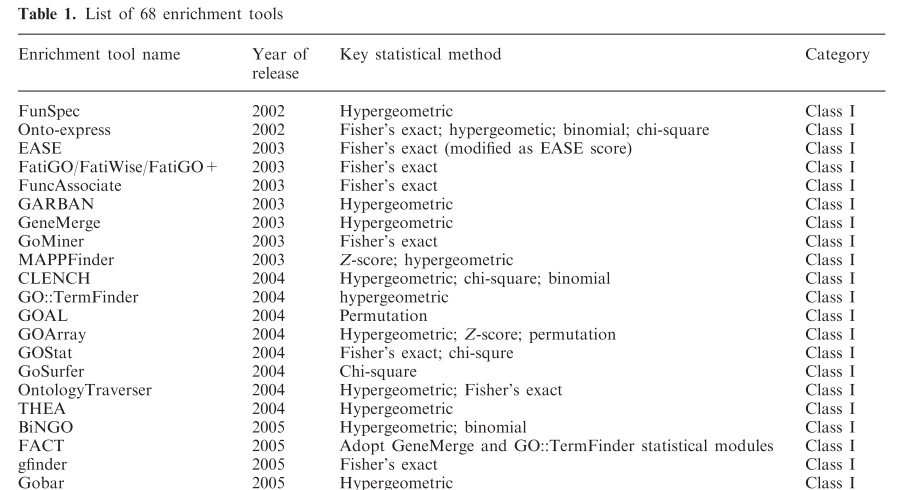
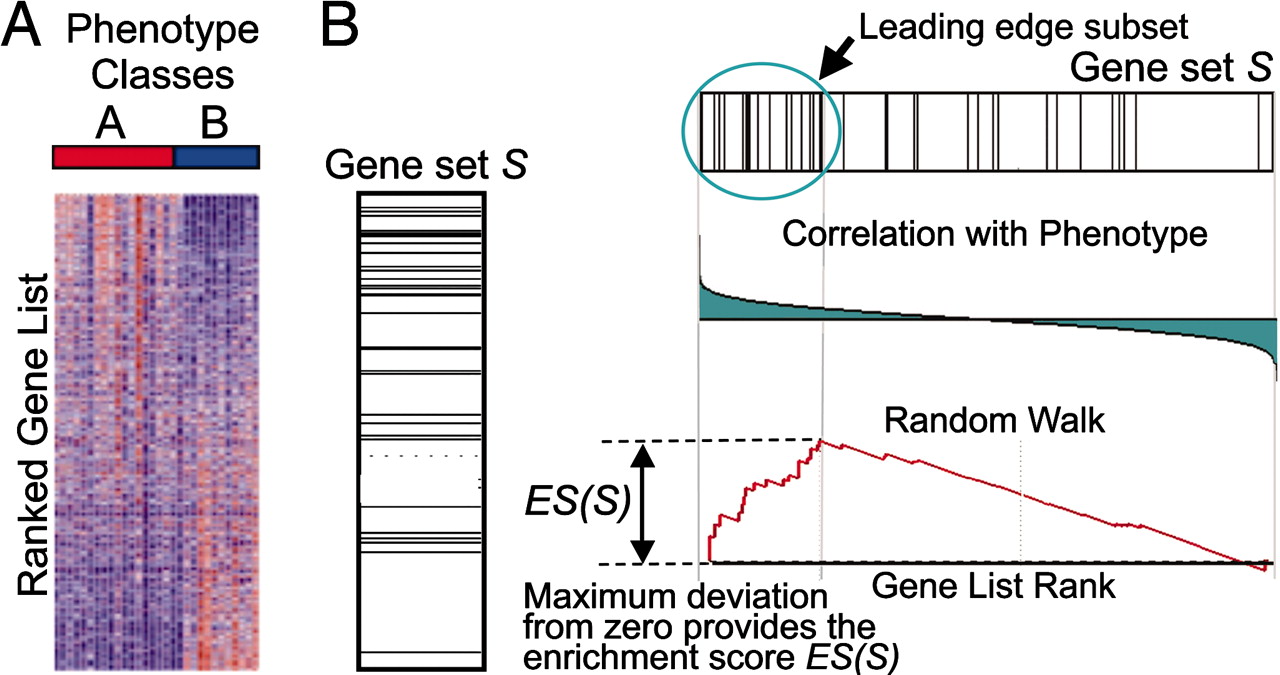
  • Numerous tools have been developed to look for "enrichment" in these resulting gene sets for genes associated with a particular known pathway or functional annotation.
  • These methods (GSEA, etc) often use statistics which make some assumptions about the distribution of annotations which may not be valid.
  • What are the effects of these assumptions the resulting interpretation?
  • Can we do better?

Example motivation: T. cruzi co-expression network

One example of where this kind of enrichment analysis could be useful is for determining possible roles for clusters of co-expressed genes.

tcruzi coex network

T. cruzi co-expression network modules detected by WGCNA

Background

Gene Ontology (GO)

What is GO?

The Gene Ontology is a controlled vocabulary, a set of standard terms—words and phrases—used for indexing and retrieving information. In addition to defining terms, GO also defines the relationships between the terms, making it a structured vocabulary. - geneontology.org

Gene Ontology (GO)

What is GO?

  • Provides a common language to describe features of genes from all different species.
  • GO database includes two main parts:
    • Ontologies
    • Gene annotations
  • Includes three separate ontologies relating to:
    • Location (cellular component)
    • Process/pathway involved in (biological process)
    • Specific function (molecular function)
  • Each ontology is represented by a directed acyclic graph (DAG).
  • Two different types of relationships exist between nodes:
    • is-a, and
    • part-of
  • Deeper levels in the ontology correspond to more specific descriptions.
  • Maintained and developed by a consortium of scientists (Gene Ontology Consortium)

Gene Ontology (GO)

Many functional enrichment tools exist

Huang table 1 Huang et al. (2009) Table 1

Common statistics used for enrichment analysis

  • Fisher's Exact Test (FET)
  • Binomial test
  • Hypergeometric test
  • Chi-squared test

All of these methods assume that, under the null hypothesis, genes are equally likely to be selected.

Gene Set Enrichment Analysis (GSEA)

  • Most popular tool for enrichment analysis
  • Uses variant of Kolmogorov–Smirnov test
    • Compares distributions of two samples
    • Null hypothesis: the samples were drawn from the same distribution
  • Looks for enrichment in genes with a known property (e.g. GO annotation) at the top of a list of genes ranked by differential expression, etc.

Gene Set Enrichment Analysis (GSEA)

GSEA fig1 Subramanian et al. (2005) Figure 1

GOstat

  • Beißbarth & Speed (2004)
  • Computes frequencies of all GO terms in two sets of genes:
    • Experiment set
    • Reference set (e.g. entire GO db)
  • Uses \(\chi^2\) and Fisher's Exact test to look for terms which are enriched in either gene set with respect to the other.
  • Performs multiple testing correction using either Holm or Benjamini and Hochberg correction.
  • Website: http://gostat.wehi.edu.au/
  • Not to be confused with "GOstats", a Bioconductor package for working with GO and microarray data...

GOSeq

  • Young et al. (2010) notice biases between gene length, number of reads, and differential expression.
  • They show that GO categories also show a length bias (many categories have significantly longer or shorter genest than expected by chance), which indicates that enrichment results could in turn be skewed by DE length bias.
  • GOSeq corrects for the length bias by random sampling of a fitted distribution based on length and DE proportion.

GOSeq fig2 Young et al. (2010) Figure 2

Fisher's Exact Test (FET)

Results

Gene ontology characteristics

Gene-term graph

  • Downloaded all human gene-term associations from the Gene Ontology website.
  • Constructed a gene/annotation graph, represented by an \(n_G \times n_T\) adjacency matrix

adj matrix

  • \(n_G\) - number of genes
  • \(n_T\) - number of GO terms
  • \(A_{ij} = 1\) - Gene \(i\) is annotated with term \(j\)
  • \(A_{ij} = 0\) - Gene \(i\) is not annotated with term \(j\)

Gene ontology characteristics

Gene and term degree distributions

fig 1

  • Biological Process terms dominate the human annotations.
  • Degree of term (\(k_t\)) distribution is "heavy-tailed"; most terms are associated with only a few genes, but some terms are used for a huge number of genes.

Gene ontology characteristics

Biological Process

The remainder of the results are based on the biological process ontology:

  • 656,783 annotations
  • 15,213 genes (avg: 43.2 annotations)
  • 10192 terms (avg: 64.4 annotations)

Question: What is the effect of annotation database properties on functional enrichment analysis?

Experiment design:

  • Created 200 random gene sets:
    • \(N_g\)=200 genes in each set (a "typical" gene set size)
    • Varied number of annotations (\(M_g\))
    • Determined FET enrichment score for each of the 10192 BP GO terms

Results

  • Number of unique annotations \(\propto\) GO enrichment significance!

Random gene set enrichment scores

fig2a-b

Perhaps the problem isn't quite so bad after correcting for multiple testing...

  • Multiple testing correction alone is not enough to deal with this bias, although it does seem to severely reduce the problem.

Figure S2

Annotation Enrichment Analysis (AEA)

fig3

Question: Does this bias also affect biologically relevant sets of genes?

Overview

  • So far, we've seen how AEA can correct for biases in the distribution of GO terms and annotation coverage across genes.
  • Does this have any impact on downstream biological interpretations?

Experiment design:

  • Downloaded all expression signatures from Gene Signatures Database (GeneSigDB) which contain \(100 <= n <= 1000\) genes which are annotated with a term in the BP ontology (total=309)
  • First, plotted average number of annotations per gene set and compared it what would be expected for random sets of genes (verify presence of bias.)
  • Next, measured enrichment in each set using FET and AEA and looked at properties of genes deemed significant in one measure but not the other.

GeneSigDB Signatures

FET enrichment bias towards well-annotated genes is also present in biological datasets:

fig4

Question: Does AEA provide any additional biological insights?

Experiment design:

  • For FET and AEA, each:
    • Selected ~40 GeneSigDB signatures with the most significant enrichment scores.
    • Select 40 GO terms with most significant enrichment scores across all signatures.
  • Performed hierarchical clustering.

Functional enrichment clusters (FET vs. AEA)

Figure 5

  • rows = gene signatures
  • columns = GO terms

Real and random term-signature comparisons

fig6

  • Created random term sets with same number of unique genes annotated as found in real GO branches
  • Measured FET/AEA enrichment in random and real go branches
  • FET find similar numbers of "significant" term-signature associations in the real and random branches!

Conclusions

Conclusions

  • Biases exist in GO and other annotation databases.
  • These biases can affect the performance of statistics such as FET in predicting significant enrichment.
  • Annotation Enrichment Analysis (AEA) accounts for these biases and is able is not as prone to detecting spurious enrichments.

Limitations

  • Performance of AEA only compared with Fisher's Exact Test (FET); how does the performance compare to other GO methods?
  • Only looked at Biological Process ontology -- is the picture the same for the other GO sub-ontologies? Other annotation databases?
  • Currently only implemented in C++ (R bindings would be nice.)
  • Does not take into account any of the addition information about the members of the experimental gene set (e.g. DE fold-change, p-value, etc)

Beyond the Gene Ontology...

References

  • T. Beissbarth, T. P. Speed, (2004) Gostat: Find Statistically Overrepresented Gene Ontologies Within A Group of Genes. Bioinformatics 20 1464-1465 10.1093/bioinformatics/bth088
  • Kimberly Glass, Michelle Girvan, (2014) Annotation Enrichment Analysis: an Alternative Method For Evaluating The Functional Properties of Gene Sets. Scientific Reports 4 10.1038/srep04191
  • D. W. Huang, B. T. Sherman, R. A. Lempicki, (2008) Bioinformatics Enrichment Tools: Paths Toward The Comprehensive Functional Analysis of Large Gene Lists. Nucleic Acids Research 37 1-13 10.1093/nar/gkn923
  • A. Subramanian, P. Tamayo, V. K. Mootha, S. Mukherjee, B. L. Ebert, M. A. Gillette, A. Paulovich, S. L. Pomeroy, T. R. Golub, E. S. Lander, J. P. Mesirov, (2005) Gene Set Enrichment Analysis: A Knowledge-Based Approach For Interpreting Genome-Wide Expression Profiles. Proceedings of The National Academy of Sciences 102 15545-15550 10.1073/pnas.0506580102
  • Matthew D Young, Matthew J Wakefield, Gordon K Smyth, Alicia Oshlack, (2010) Gene Ontology Analysis For Rna-Seq: Accounting For Selection Bias. Genome Biology 11 R14-NA 10.1186/gb-2010-11-2-r14

  • Weisstein, Eric W. "Fisher's Exact Test." From MathWorld--A Wolfram Web Resource. http://mathworld.wolfram.com/FishersExactTest.html